SellM8 Analytics In use by clients
Sales analytics that shows which customers you are losing
Upload the monthly report from Excel and see which customer buys less, which sales rep is growing and what to expect next month — without formulas or pivot tables.
- months back in one report
- 13
- forecasts — next month and next quarter
- 2
- ways of spotting duplicate names
- 9
- export formats — Excel and CSV
- 2
When reports in Excel start costing money
SellM8 Analytics is for managers who want the answer while they can still act on it.
Book a demo-
The monthly report is ready when the month is long gone.
-
You find out a customer has stopped buying when they are already with a competitor.
-
The same customer is spelled three different ways, so their turnover is split across three rows.
-
You do not know which outlets each sales rep supplied this month.
BI and sales analytics
What is SellM8 Analytics?
SellM8 Analytics is browser-based sales analysis software for companies that sell through sales representatives. You upload the monthly sales reports from Excel, and the program turns them into dashboards and reports by customer, sales rep, city and product, with a forecast for the next month and quarter. It is developed by T&B Technology in Bulgaria.
Who it is for
- Distributors and wholesalers with sales representatives
- Managers and sales directors who make decisions based on the numbers
- Companies that put their monthly reports together in Excel today
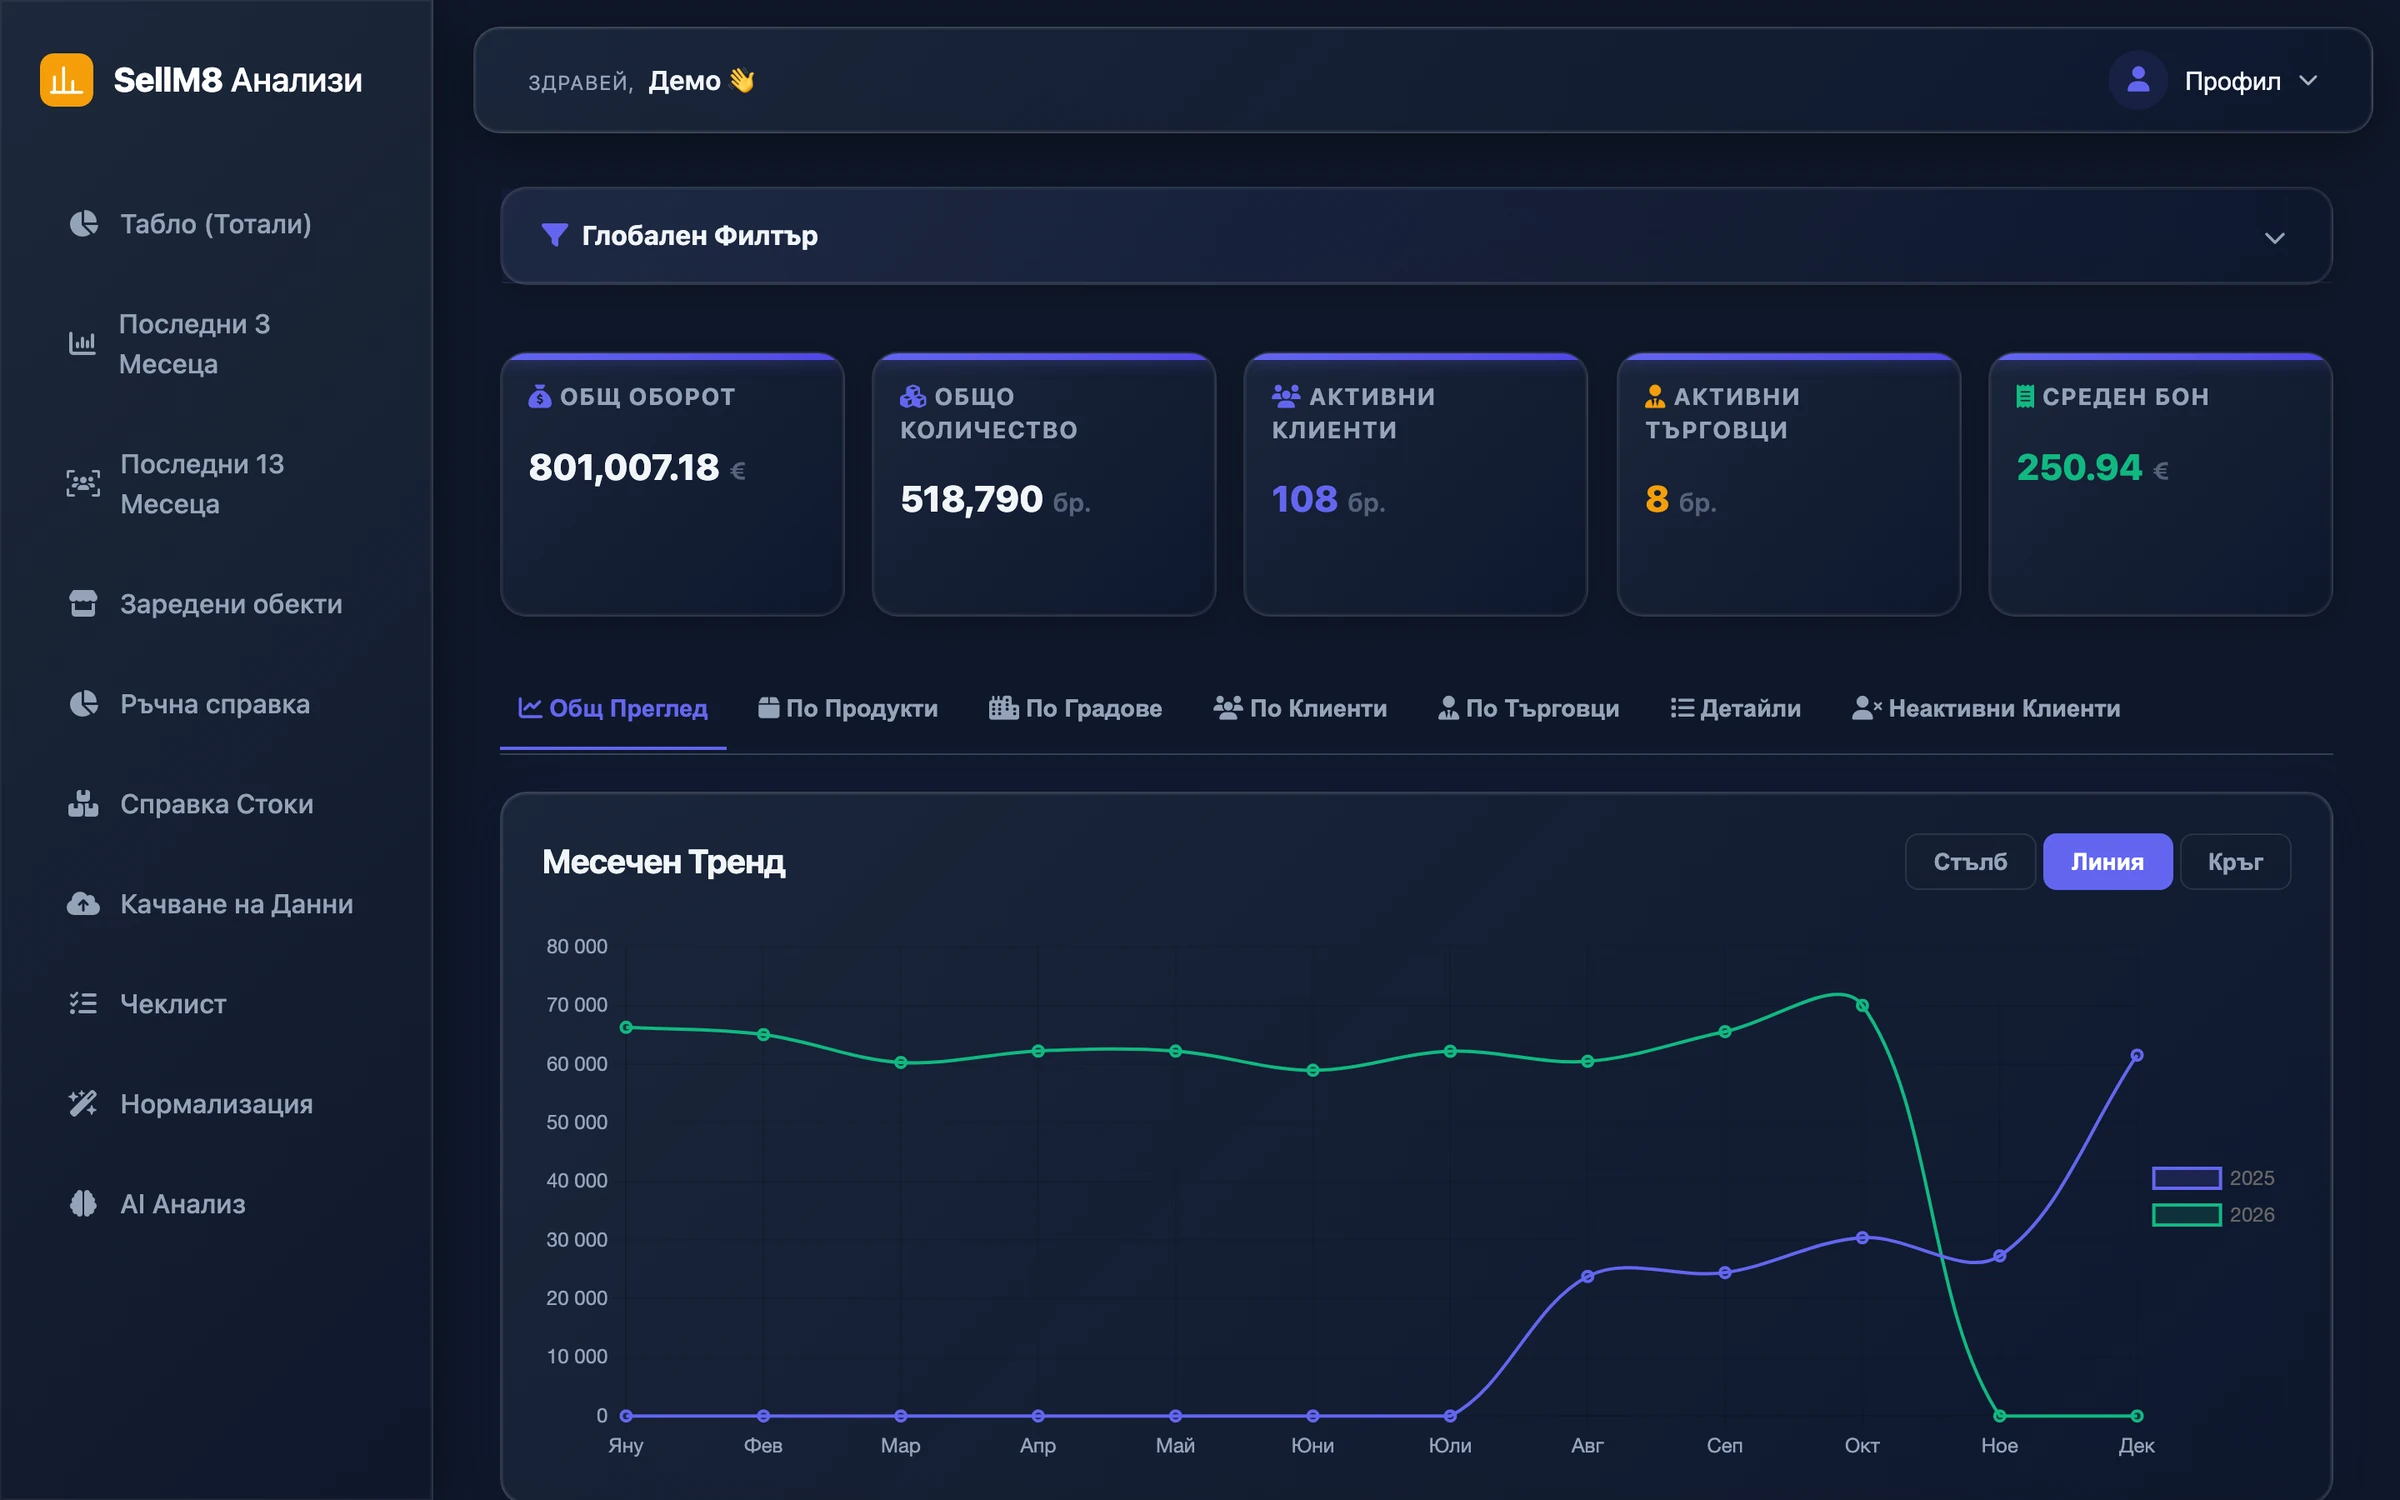
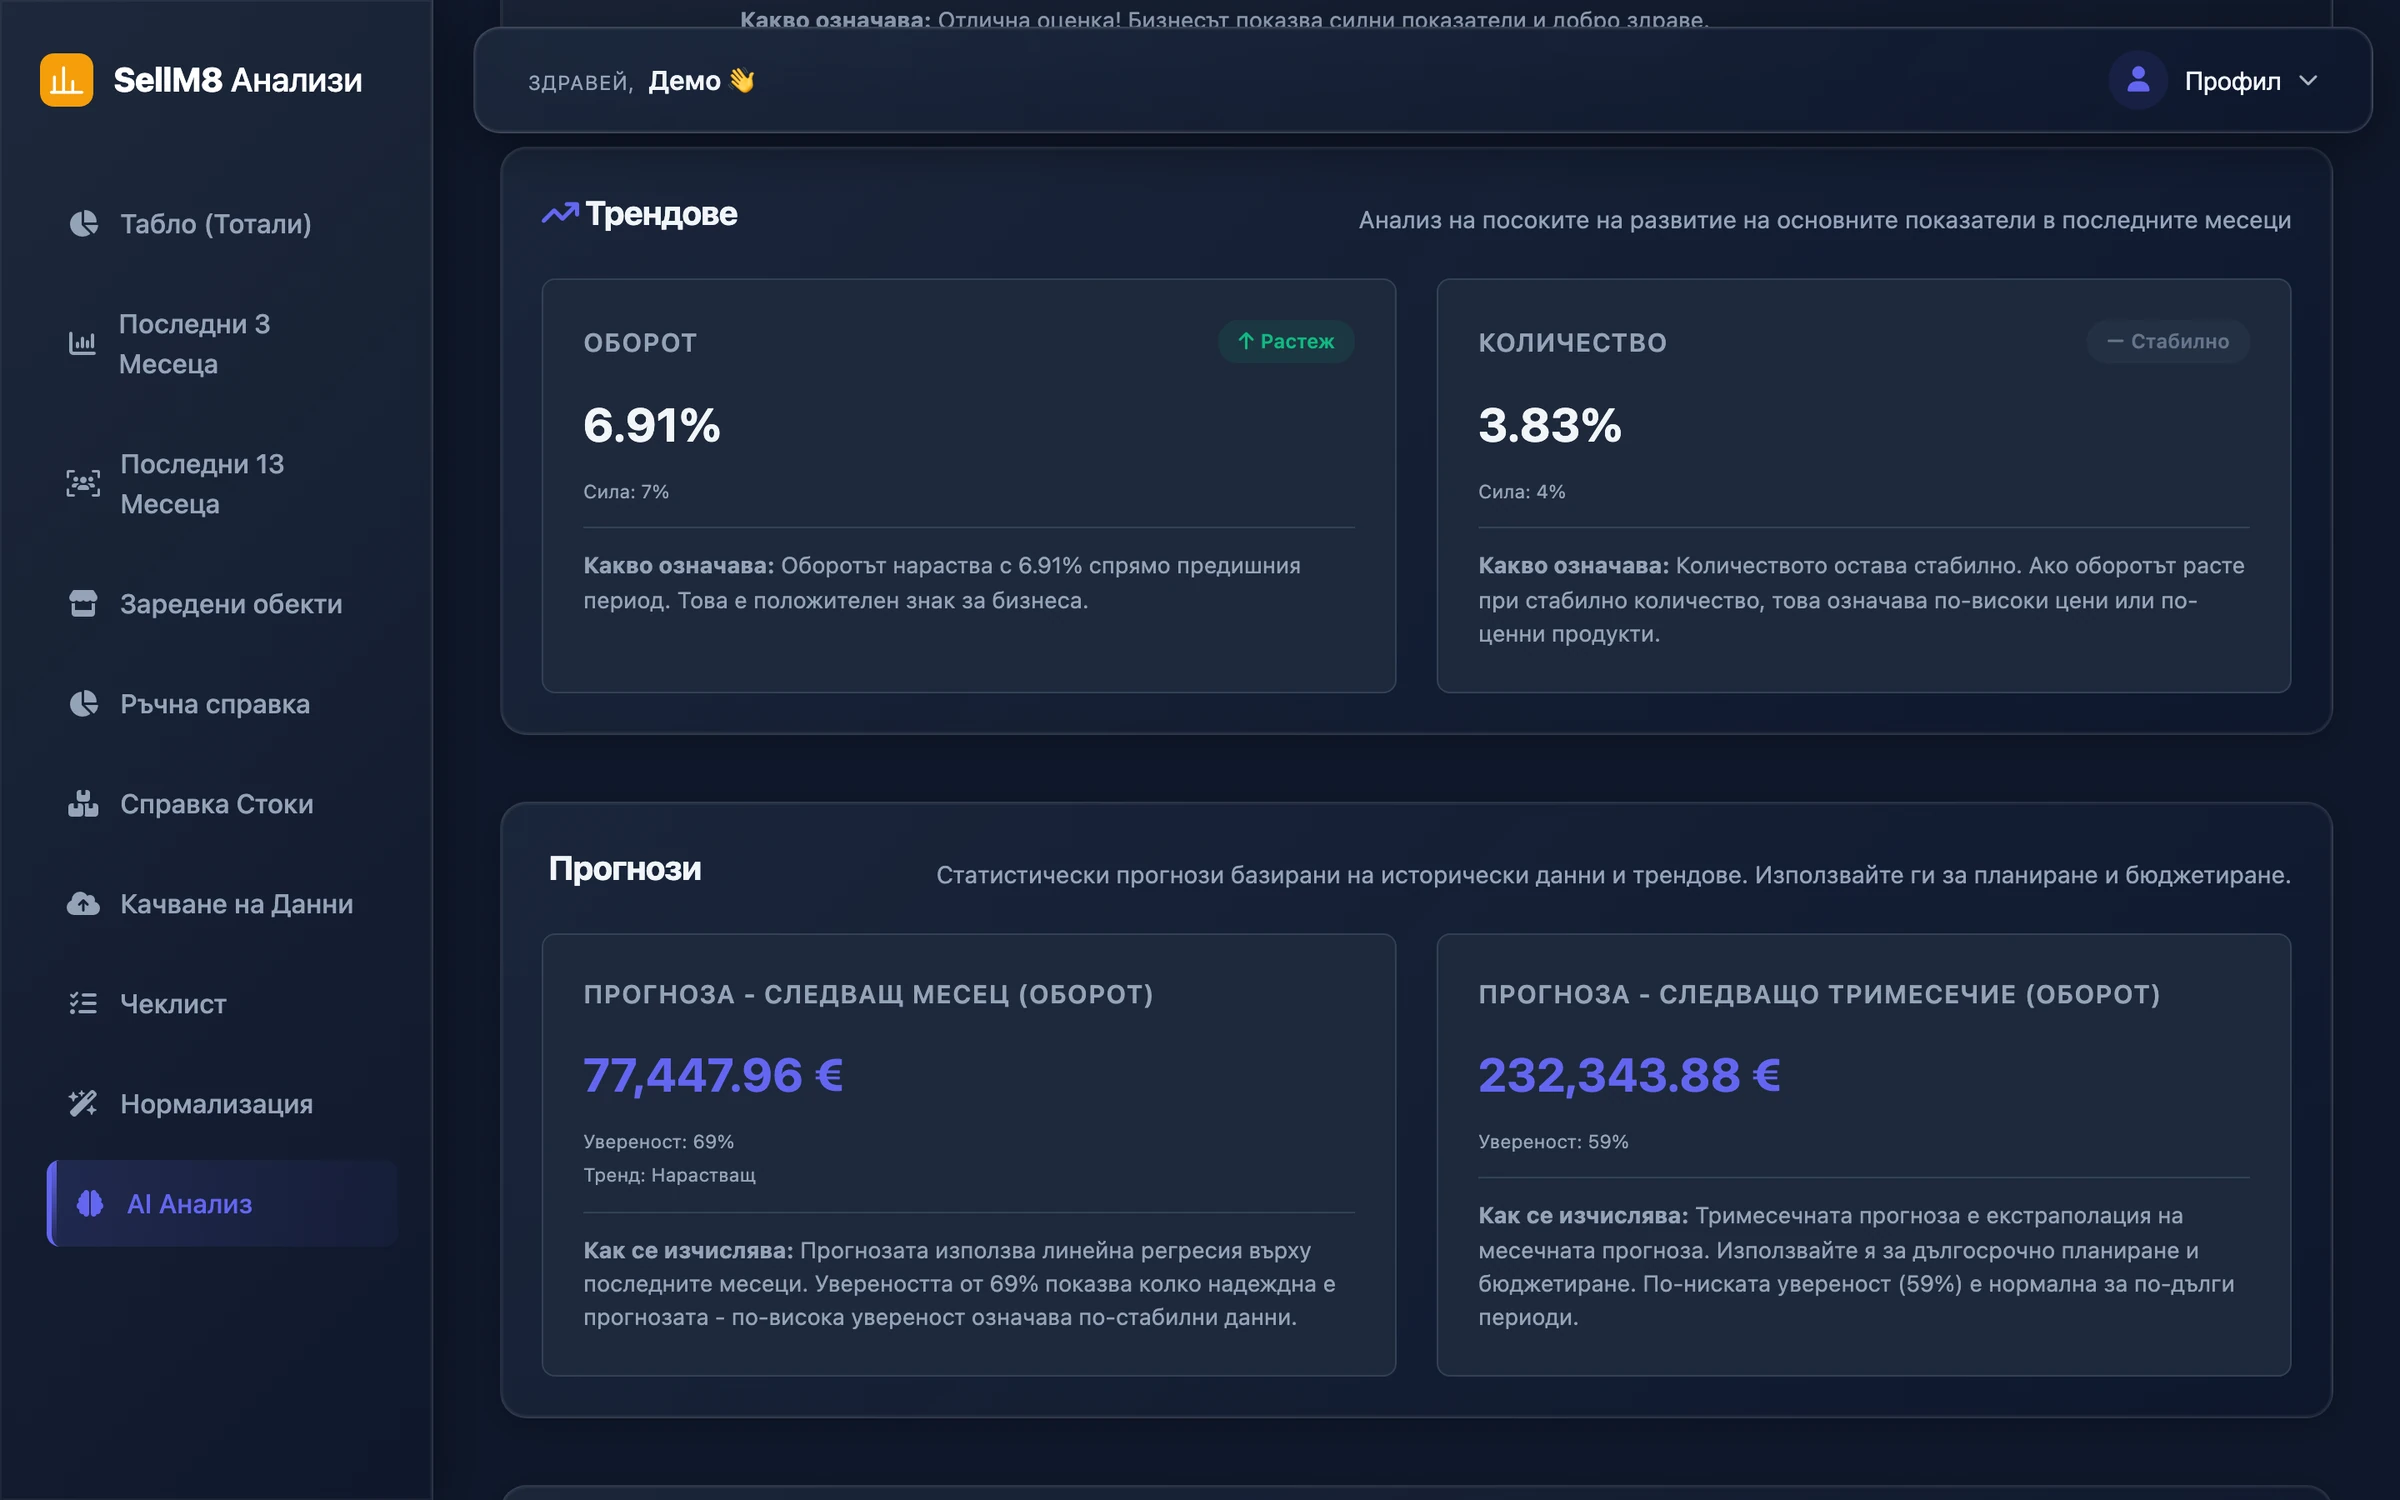
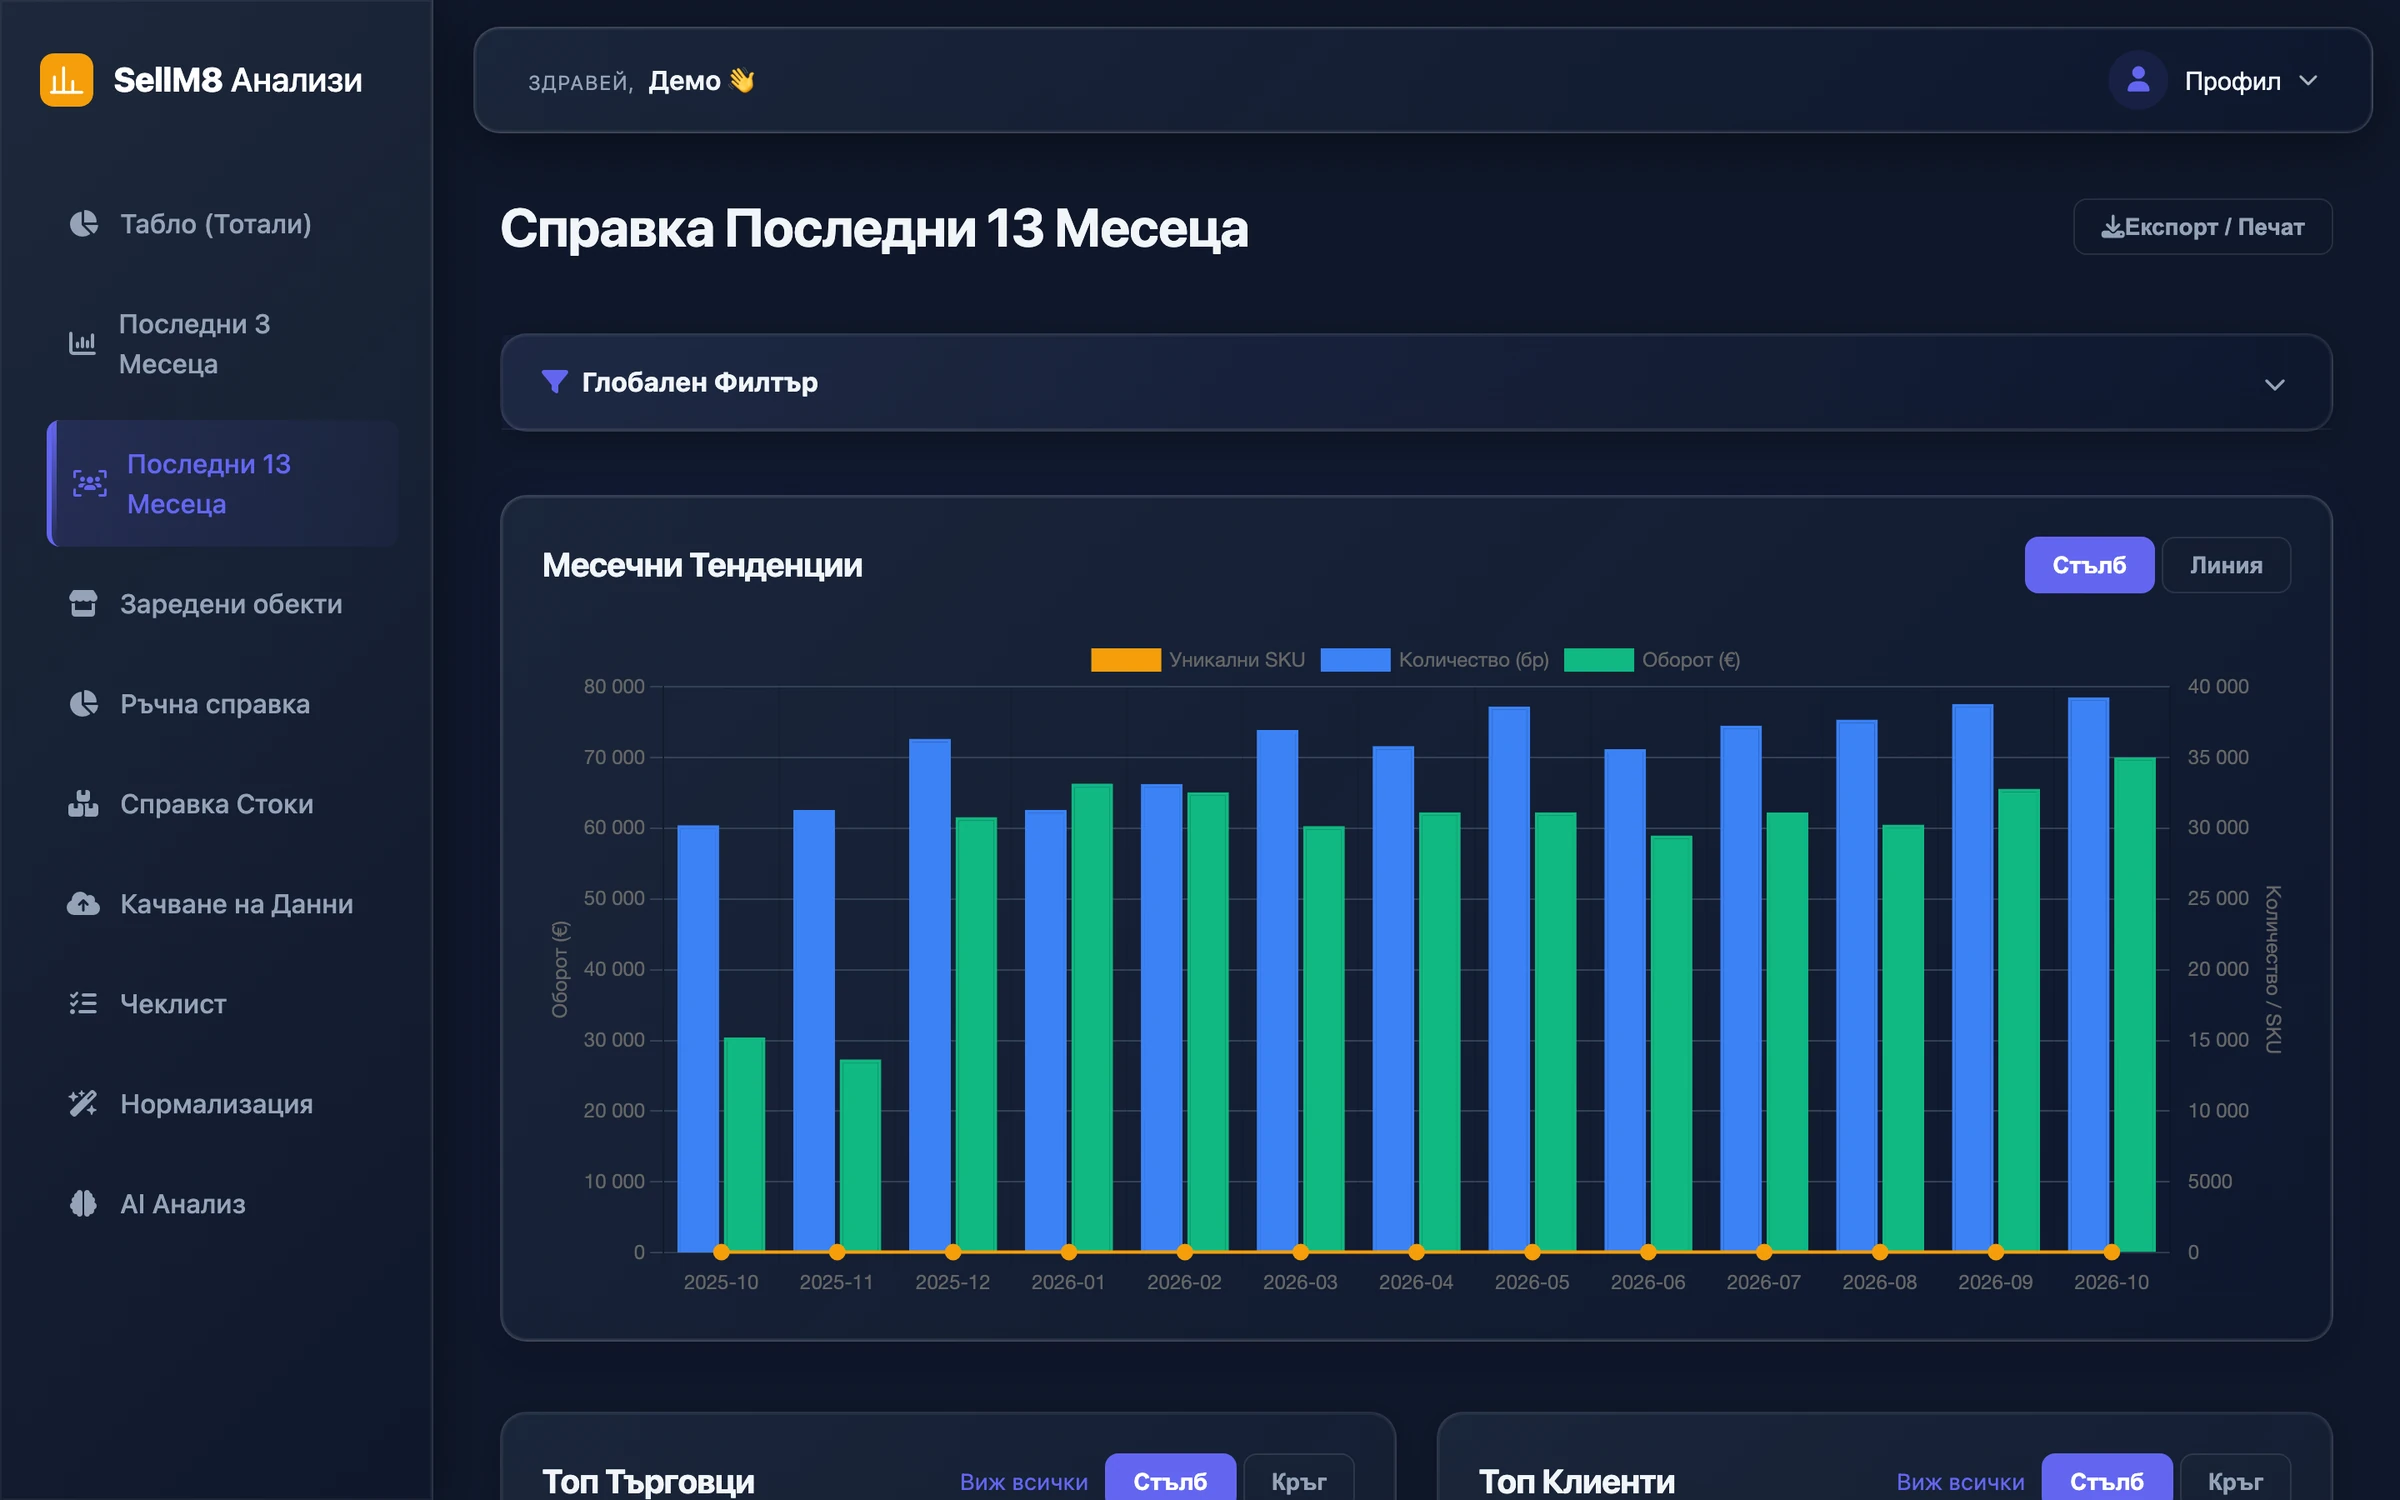
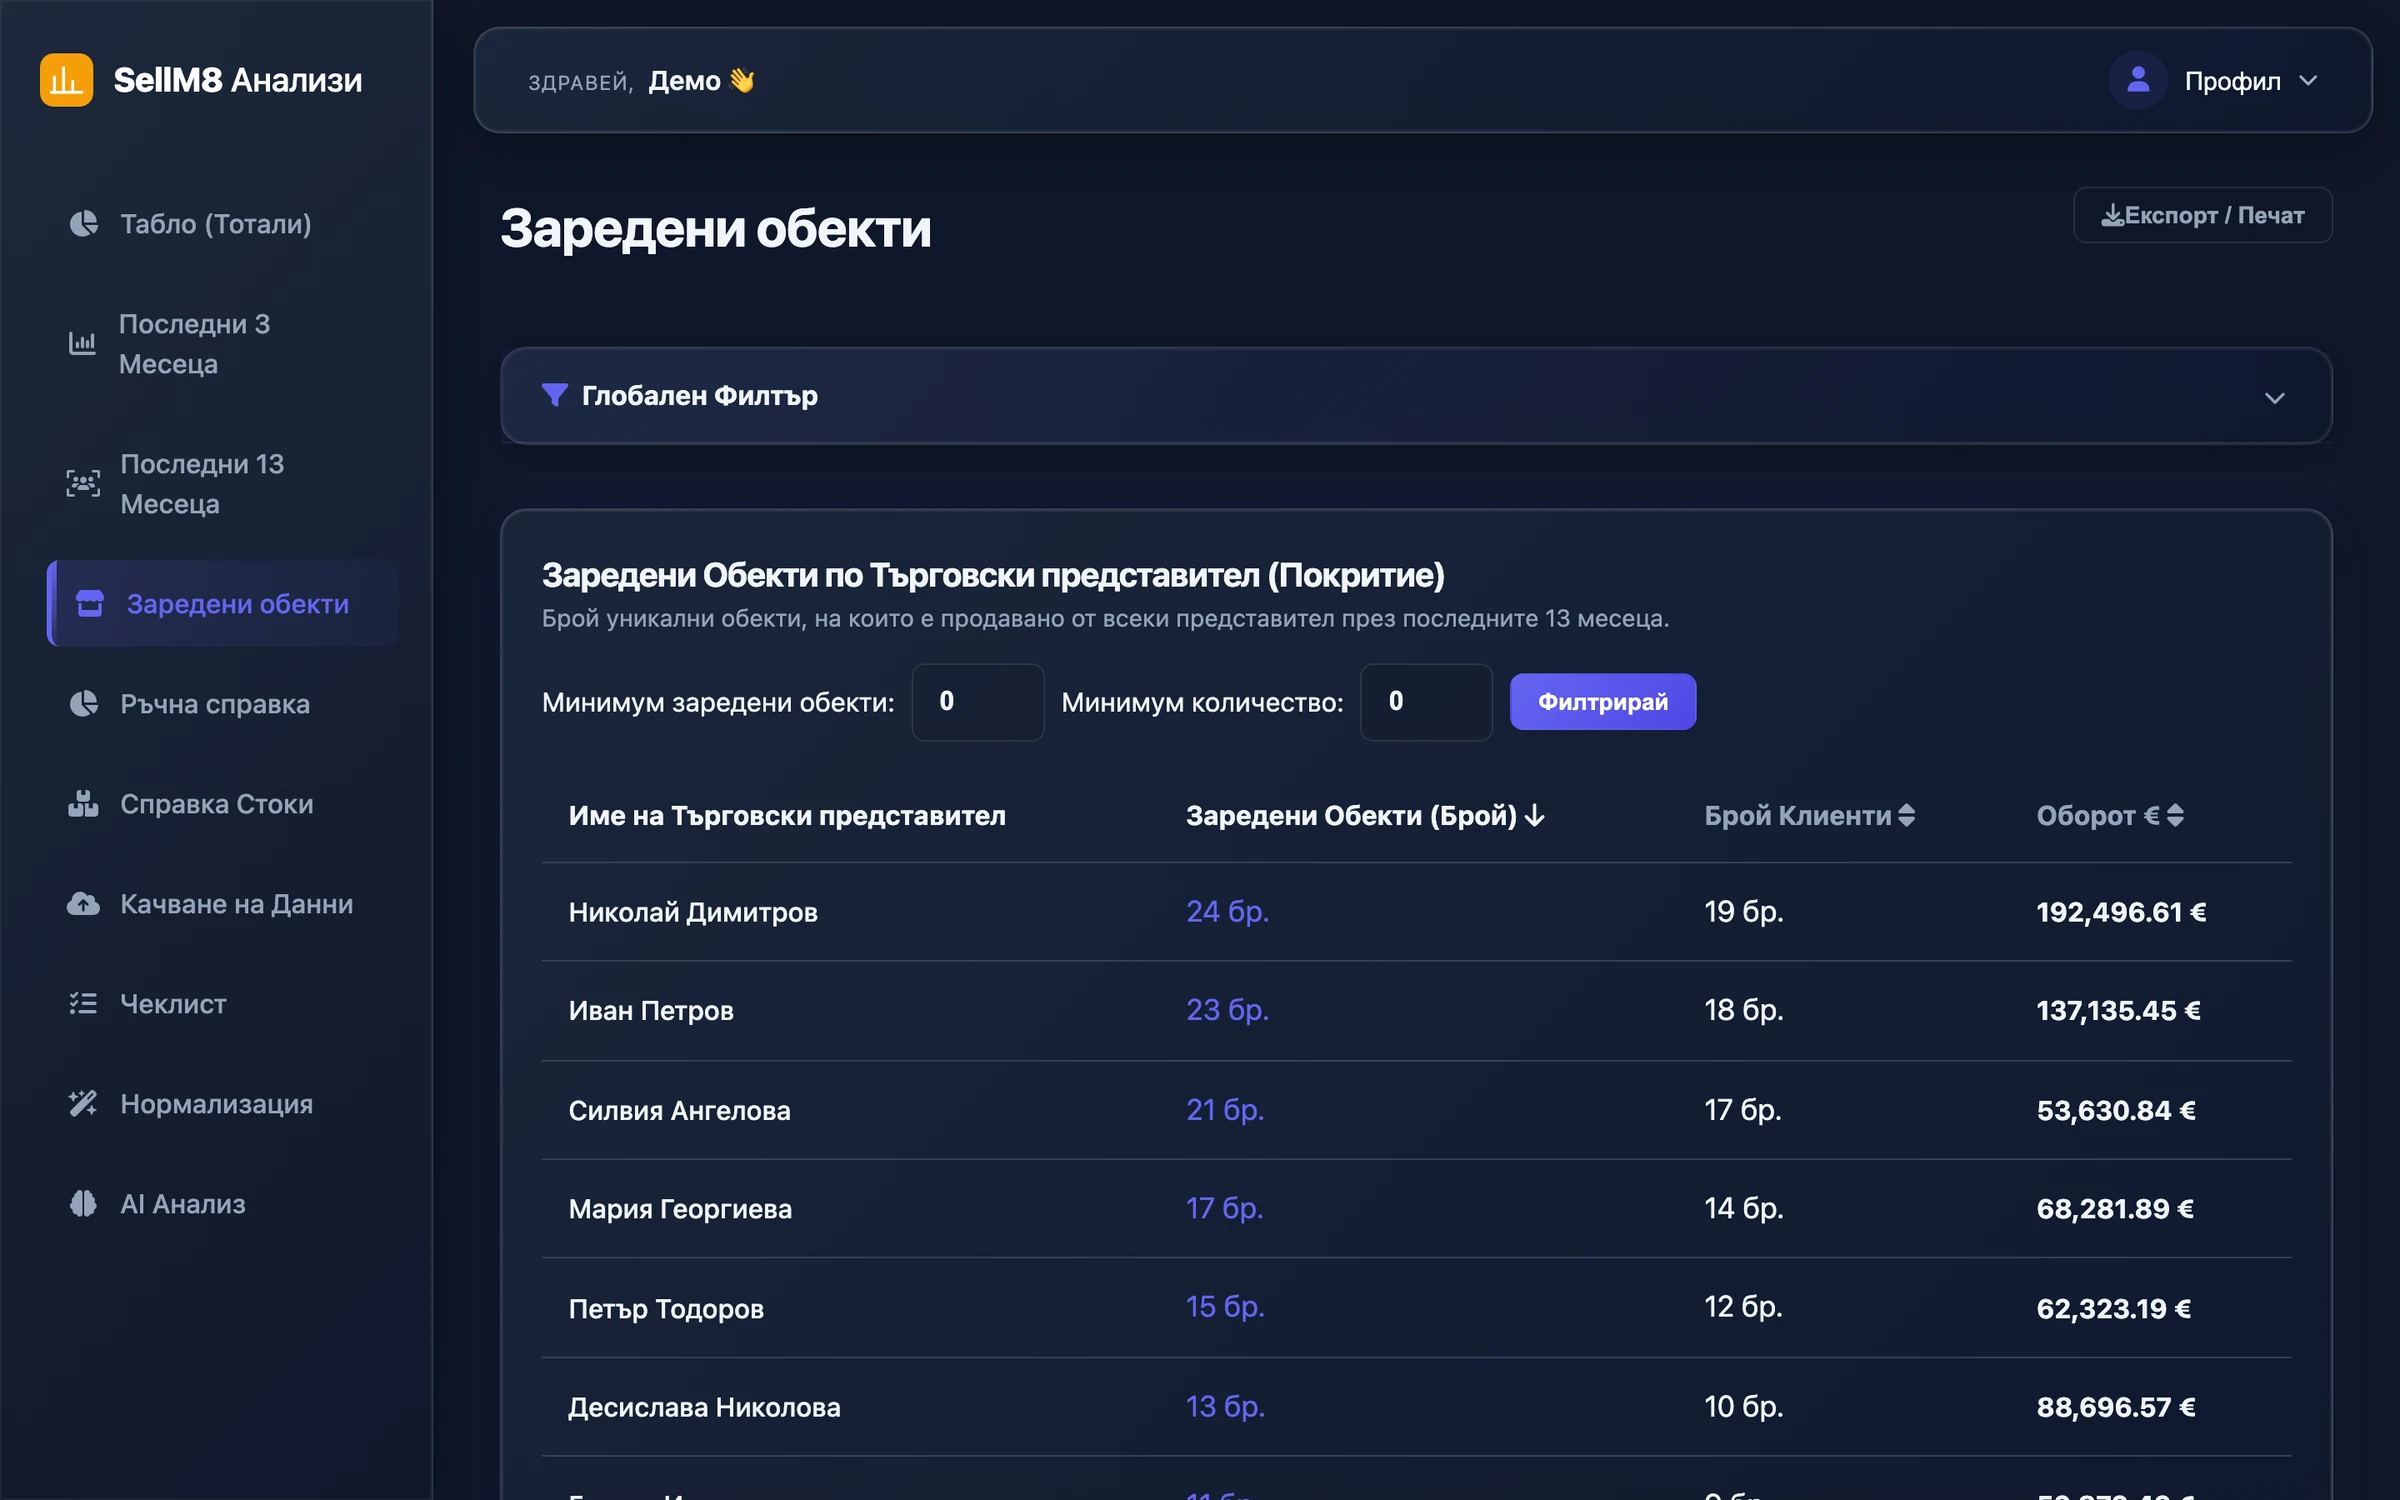
A look at SellM8 Analytics
Screens from the program itself, with sample data. The interface is shown in Bulgarian.
Why SellM8 Analytics
-
From Excel to a dashboard without formulas
Upload the monthly sales report. The program warns you if the period has already been uploaded and turns the file into dashboards and reports.
-
See which customers stop buying
There is a separate report on customers with no purchases in the chosen period, and a purchase history for every customer.
-
Know what every sales rep is doing
Turnover and quantities per sales representative, supplied outlets and coverage, and a detailed 13-month report.
-
A forecast that states its confidence
The analysis calculates expected turnover for the next month and quarter, shows how confident it is and explains how it was worked out.
-
Clean data without cleaning it by hand
The program spots duplicate and similar names and suggests merging them. A wrong merge can be restored from the recycle bin.
-
Protected access to the numbers
Two-step sign-in, an email alert on sign-in and a log of who signed in and when.
What is included SellM8 Analytics
The full list — open the topic that interests you.
Dashboard
- Monthly sales trend
- Top products, customers and sales reps
- Sales by city
- Switch between turnover and quantity
- Charts — line, bar, doughnut and radar
Reports
- Last 3 months and last 13 months
- Custom report for a period of your choice, with quarterly trends
- Product report, including promo variants
- Supplied outlets and coverage per sales representative
- Checklist — a matrix of customers and products
- Customers without purchases and a customer's purchase history
- Detailed reports by customer and by sales rep
- Average purchase value
Filters and export
- One shared filter for all reports
- Saved filter presets
- Export to Excel and CSV
Data
- Monthly sales report uploaded from Excel
- Reference lists for products, prices and partners
- A warning when a period has already been uploaded
- Upload history
- Merging of duplicate and similar names
- A recycle bin with restore
Analysis and forecasts
- Trends and seasonality
- Forecast for the next month and the next quarter
- Alerts on unusual values
- Recommendations, opportunities and risks
- Data quality rating
- Summary by an AI model installed on your premises (optional)
Security
- Two-step sign-in
- Strong password requirements
- Email alert on sign-in
- Sign-in and access logs
- User management
SellM8 Analytics compared with reports in Excel
| What we compare | SellM8 Analytics | Reports in Excel |
|---|---|---|
| Preparation | Upload the file and the dashboards are ready | Formulas and pivot tables by hand |
| Inactive customers | A separate report on customers with no purchases | You look for them row by row |
| Duplicate names | Found for you, with a suggested merge | Fixed by hand in every file |
| Forecast | For the next month and quarter, with confidence | Only if you work it out yourself |
| Access | From a browser, with two-step sign-in | A file sent around by email |
Questions about SellM8 Analytics
What data does SellM8 Analytics need?
The monthly sales report in Excel and the reference lists for products, prices and partners. You upload them in the browser, and SellM8 Analytics warns you if the period has already been uploaded.
How far back does it show?
There are ready reports for the last 3 and the last 13 months, and a custom report for any period you choose.
How is the forecast made?
It is calculated from the trend and seasonality in your own sales — for the next month and for the next quarter. Each forecast states its confidence and how it was worked out. When there is not enough data, the program says so.
Does it need an external AI service?
No. The analysis and the data cleaning run on the program's own algorithms. If you wish, you can switch on an AI model installed on your own server, so the data never leaves the company.
Can I export the reports?
Yes. Every report exports to Excel or CSV.
Does it work with our warehouse program?
Data comes in as an Excel file. We agree the file format with you during setup.
Guides on this topic
Updated:
See SellM8 Analytics with your own file
Send us one monthly report and we will show you what comes out of it.
- Reply within one working day
- No obligation to buy
- Demo with your own examples